Hello, world
A first post to check that math, plots, and tables render.
Everything on this page is plain HTML. The math is MathML that pandoc generates at build time, and the plot is an SVG file made by R.
Inline math: .
Display math:
An aligned derivation:
set.seed(1)
x <- rnorm(100)
y <- 0.5 * x + rnorm(100, sd = 0.7)
par(mar = c(4, 4, 1, 1))
plot(x, y, pch = 19, col = "#0b5e7466", las = 1)
abline(lm(y ~ x), lwd = 2)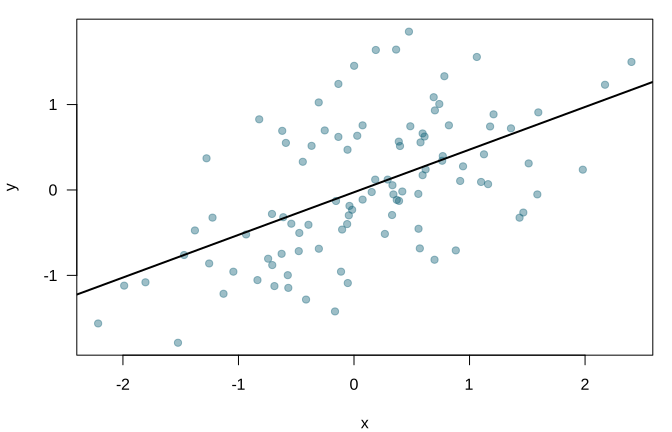
| Estimate | Std. Error | t value | Pr(>|t|) | |
|---|---|---|---|---|
| (Intercept) | -0.026 | 0.068 | -0.389 | 0.698 |
| x | 0.499 | 0.075 | 6.621 | 0.000 |